- Afhalen na 1 uur in een winkel met voorraad
- Gratis thuislevering in België vanaf € 30
- Ruim aanbod met 7 miljoen producten
- Afhalen na 1 uur in een winkel met voorraad
- Gratis thuislevering in België vanaf € 30
- Ruim aanbod met 7 miljoen producten
Zoeken
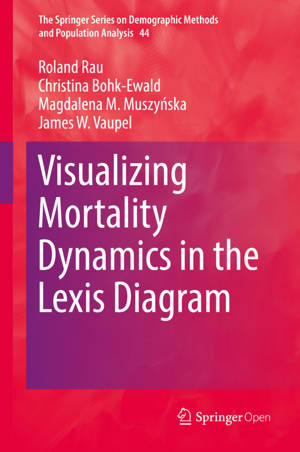
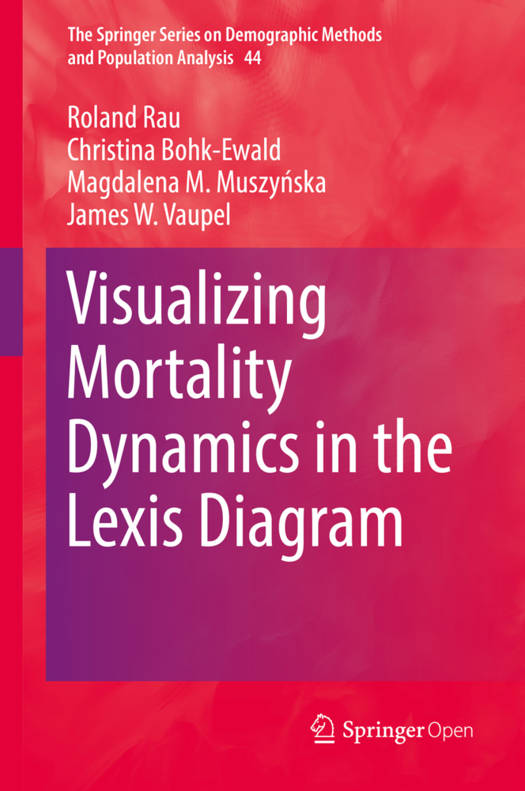
Visualizing Mortality Dynamics in the Lexis Diagram
Roland Rau, Christina Bohk-Ewald, Magdalena M Muszyńska, James W Vaupel
€ 52,95
+ 105 punten
Uitvoering
Omschrijving
This book visualizes mortality dynamics in the Lexis diagram. While the standard approach of plotting death rates is also covered, the focus in this book is on the depiction of rates of mortality improvement over age and time. This rather novel approach offers a more intuitive understanding of the underlying dynamics, enabling readers to better understand whether period- or cohort-effects were instrumental for the development of mortality in a particular country. Besides maps for single countries, the book includes maps on the dynamics of selected causes of death in the United States, such as cardiovascular diseases or lung cancer. The book also features maps for age-specific contributions to the change in life expectancy, for cancer survival and for seasonality in mortality for selected causes of death in the United States. The book is accompanied by instructions on how to use the freely available R Software to produce these types of surface maps. Readers are encouraged to use the presented tools to visualize other demographic data or any event that can be measured by age and calendar time, allowing them to adapt the methods to their respective research interests. The intended audience is anyone who is interested in visualizing data by age and calendar time; no specialist knowledge is required.
This book is open access under a CC BY license.
Specificaties
Betrokkenen
- Auteur(s):
- Uitgeverij:
Inhoud
- Aantal bladzijden:
- 169
- Taal:
- Engels
- Reeks:
- Reeksnummer:
- nr. 44
Eigenschappen
- Productcode (EAN):
- 9783319648187
- Verschijningsdatum:
- 23/11/2017
- Uitvoering:
- Hardcover
- Formaat:
- Genaaid
- Afmetingen:
- 156 mm x 234 mm
- Gewicht:
- 435 g

Alleen bij Standaard Boekhandel
+ 105 punten op je klantenkaart van Standaard Boekhandel
Beoordelingen
We publiceren alleen reviews die voldoen aan de voorwaarden voor reviews. Bekijk onze voorwaarden voor reviews.


