- Afhalen na 1 uur in een winkel met voorraad
- Gratis thuislevering in België vanaf € 30
- Ruim aanbod met 7 miljoen producten
- Afhalen na 1 uur in een winkel met voorraad
- Gratis thuislevering in België vanaf € 30
- Ruim aanbod met 7 miljoen producten
Zoeken
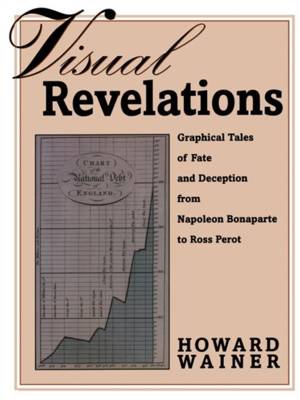
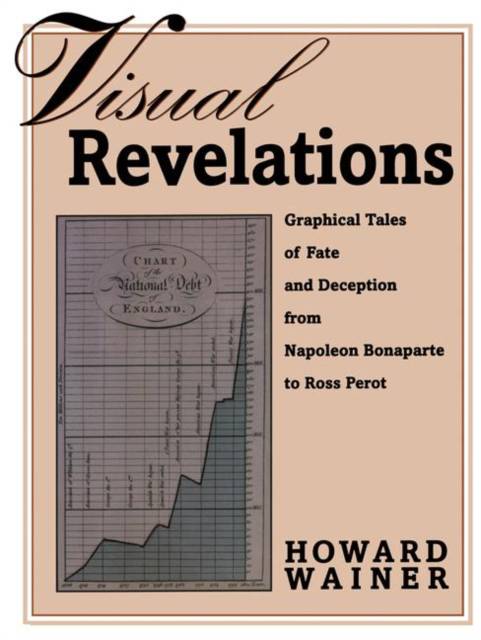
Visual Revelations
Graphical Tales of Fate and Deception from Napoleon Bonaparte to Ross Perot
Howard Wainer
Paperback | Engels
€ 69,95
+ 139 punten
Uitvoering
Omschrijving
This extraordinary book provides a journey through the jungle of good and bad graphical devices used to illustrate and obfuscate data. The diversity of examples is tremendous: ranging from Napoleon's retreat from Moscow to the O-rings on the space shuttle and from mortalities in hospitals to the schedules of buses. The author's aim is to illustrate how effectively a well-chosen graphic can reveal in an instant the essential truth behind some data whilst a poorly designed representation can conceal an awful truth. As well as providing numerous examples of both, the author includes plenty of helpful ideas to make us all better producers and consumers of graphics.
Specificaties
Betrokkenen
- Auteur(s):
- Uitgeverij:
Inhoud
- Aantal bladzijden:
- 180
- Taal:
- Engels
Eigenschappen
- Productcode (EAN):
- 9781461274865
- Verschijningsdatum:
- 6/10/2011
- Uitvoering:
- Paperback
- Formaat:
- Trade paperback (VS)
- Afmetingen:
- 210 mm x 279 mm
- Gewicht:
- 471 g

Alleen bij Standaard Boekhandel
+ 139 punten op je klantenkaart van Standaard Boekhandel
Beoordelingen
We publiceren alleen reviews die voldoen aan de voorwaarden voor reviews. Bekijk onze voorwaarden voor reviews.


