Door een staking bij bpost kan je online bestelling op dit moment iets langer onderweg zijn dan voorzien. Dringend iets nodig? Onze winkels ontvangen jou met open armen!
- Afhalen na 1 uur in een winkel met voorraad
- Gratis thuislevering in België vanaf € 30
- Ruim aanbod met 7 miljoen producten
Door een staking bij bpost kan je online bestelling op dit moment iets langer onderweg zijn dan voorzien. Dringend iets nodig? Onze winkels ontvangen jou met open armen!
- Afhalen na 1 uur in een winkel met voorraad
- Gratis thuislevering in België vanaf € 30
- Ruim aanbod met 7 miljoen producten
Zoeken
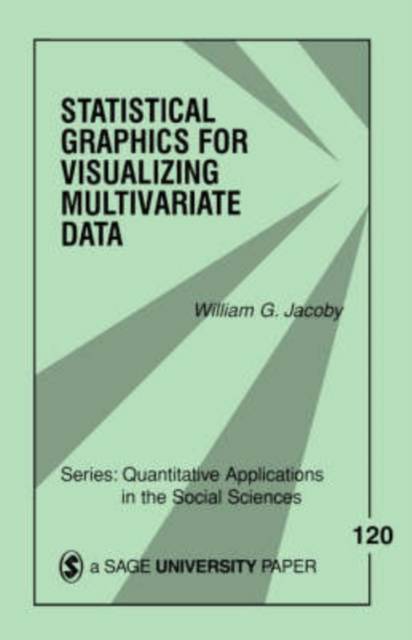
Statistical Graphics for Visualizing Multivariate Data, Volume 120
William G Jacoby
€ 70,45
+ 140 punten
Omschrijving
This book explores a variety of graphical displays that are useful for visualizing multivariate data. The basic problem involves representing information that varies along several dimensions when the display medium (a computer screen or printed page) is inherently two-dimensional. In order to address this problem, William G Jacoby introduces the concept of a `data space′.
Specificaties
Betrokkenen
- Auteur(s):
- Uitgeverij:
Inhoud
- Aantal bladzijden:
- 112
- Taal:
- Engels
- Reeks:
- Reeksnummer:
- nr. 120
Eigenschappen
- Productcode (EAN):
- 9780761908999
- Verschijningsdatum:
- 6/02/1998
- Uitvoering:
- Paperback
- Formaat:
- Trade paperback (VS)
- Afmetingen:
- 152 mm x 203 mm
- Gewicht:
- 136 g

Alleen bij Standaard Boekhandel
+ 140 punten op je klantenkaart van Standaard Boekhandel
Beoordelingen
We publiceren alleen reviews die voldoen aan de voorwaarden voor reviews. Bekijk onze voorwaarden voor reviews.


