- Afhalen na 1 uur in een winkel met voorraad
- Gratis thuislevering in België vanaf € 30
- Ruim aanbod met 7 miljoen producten
- Afhalen na 1 uur in een winkel met voorraad
- Gratis thuislevering in België vanaf € 30
- Ruim aanbod met 7 miljoen producten
Omschrijving
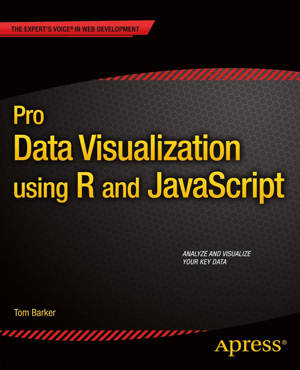
With the popularity of the R language, the art and practice of creating data visualizations is no longer the preserve of mathematicians, statisticians, or cartographers. As technology leaders, we can gather metrics around what we do and use data visualizations to communicate that information. Pro Data Visualization using R and JavaScript combines the power of the R language with the simplicity and familiarity of JavaScript to display clear and informative data visualizations.
Gathering and analyzing empirical data is the key to truly understanding anything. We can track operational metrics to quantify the health of our products in production. We can track quality metrics of our projects, and even use our data to identify bad code. Visualizing this data allows anyone to read our analysis and easily get a deep understanding of the story the data tells.
Specificaties
Betrokkenen
- Auteur(s):
- Uitgeverij:
Inhoud
- Aantal bladzijden:
- 216
- Taal:
- Engels
Eigenschappen
- Productcode (EAN):
- 9781430258063
- Verschijningsdatum:
- 19/06/2013
- Uitvoering:
- Paperback
- Formaat:
- Trade paperback (VS)
- Afmetingen:
- 188 mm x 234 mm
- Gewicht:
- 408 g

Alleen bij Standaard Boekhandel
Beoordelingen
We publiceren alleen reviews die voldoen aan de voorwaarden voor reviews. Bekijk onze voorwaarden voor reviews.


