- Afhalen na 1 uur in een winkel met voorraad
- Gratis thuislevering in België vanaf € 30
- Ruim aanbod met 7 miljoen producten
- Afhalen na 1 uur in een winkel met voorraad
- Gratis thuislevering in België vanaf € 30
- Ruim aanbod met 7 miljoen producten
Zoeken
€ 33,95
+ 67 punten
Omschrijving
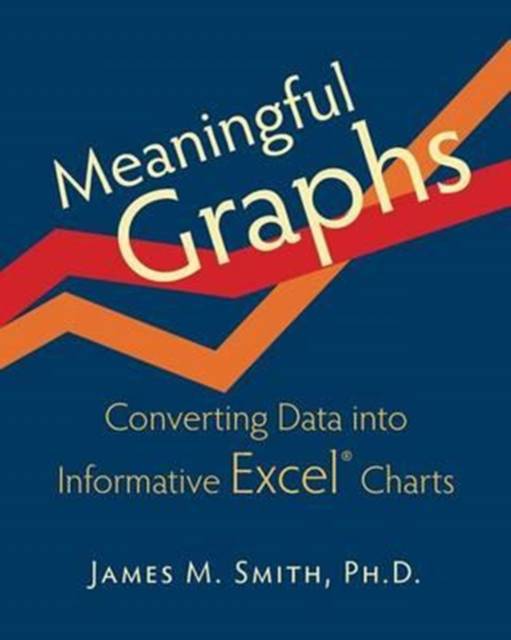
Meaningful Graphs is a concise and practical go-to guide for creating charts in Excel (R) that clearly and accurately tell the story in your data. It incorporates (a) explanations of the graph design principles of the experts (Tufte, Few, Robbins, Zelazny, and others), (b) the software steps necessary to incorporate these principles into Excel (R) charts, and (c) chart-related discussions of quality improvement (including Pareto charts), statistics (including run charts and correlations), and the use of graphs in PowerPoint (R) presentations (including chart animation). Also included are numerous "Tips" and "In Practice" examples drawn from over 35 years of working with data in healthcare settings. Coverage begins with highlighting the importance of knowing the story in your data and general principles of chart design (e.g., chartjunk, the use of color, consideration of three dimensional charts) and then proceeds to examine and create the five major chart types (column, bar, line, pie, scatter). This is followed by considerations of the pros and cons of each of the six less frequently employed chart types. There are over 120 graphs in full color plus tables and illustrations. Discussions of the most useful chart types include examples with accompanying data to facilitate practice. While illustrations are especially tailored for healthcare professionals (physicians, nurses, patient safety, quality improvement staff, executives, and managers) both in their work setting and in their academic preparation, the principles of graph design and the Excel (R) techniques required to incorporate these principles apply equally well in other settings. The latter include other industries and academic programs, including those leading to degrees in business administration (MBA), public health (MPH), and public administration (MPA). If you follow the advice in this book, the graphs you create for reports, presentations, posters, or publications will be more informative and more easily understood.
Specificaties
Betrokkenen
- Auteur(s):
- Uitgeverij:
Inhoud
- Aantal bladzijden:
- 228
- Taal:
- Engels
Eigenschappen
- Productcode (EAN):
- 9780986054907
- Verschijningsdatum:
- 1/06/2014
- Uitvoering:
- Paperback
- Formaat:
- Trade paperback (VS)
- Afmetingen:
- 203 mm x 254 mm
- Gewicht:
- 458 g

Alleen bij Standaard Boekhandel
+ 67 punten op je klantenkaart van Standaard Boekhandel
Beoordelingen
We publiceren alleen reviews die voldoen aan de voorwaarden voor reviews. Bekijk onze voorwaarden voor reviews.


