- Afhalen na 1 uur in een winkel met voorraad
- Gratis thuislevering in België vanaf € 30
- Ruim aanbod met 7 miljoen producten
- Afhalen na 1 uur in een winkel met voorraad
- Gratis thuislevering in België vanaf € 30
- Ruim aanbod met 7 miljoen producten
Omschrijving
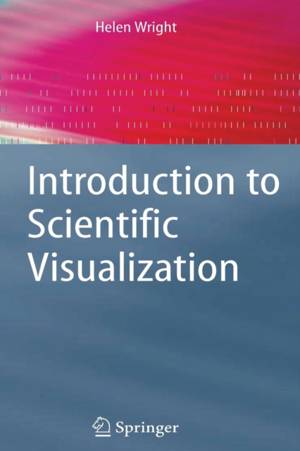
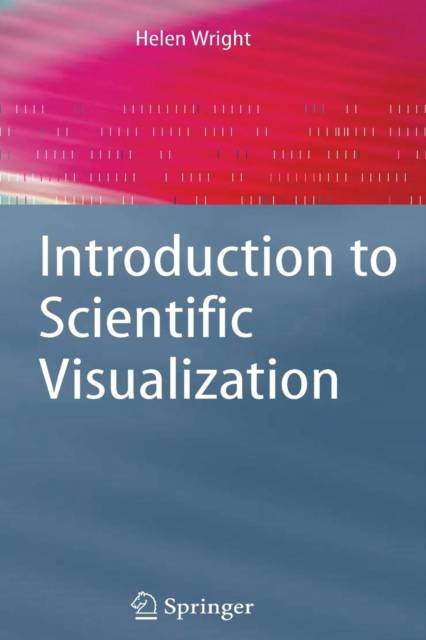
This is a 'how to' book for scientific visualization. SciViz has not been covered in an approachable form (other than in compilations of research papers) since Brodlie's seminal work "Scientific Visualization: Techniques and Applications" in 1992. This book does not treat the subject as a subset of information visualisation, but rather as a subject in its own right and the author uses a straightforward approach with a non-mathematical basis. An introduction on the philosophy of the subject sets the scene. The theory of colour perception and its value and use for conveying information about data is introduced. Next, using Brodlie's taxonomy to underpin its core chapters, it is shown how to classify data. Worked examples are given throughout the text and there are practical 'sidebars' - virtual laboratory classes for those readers with access to the IRIS Explorer software who can try out the demonstrations on an accompanying website. The book concludes with a 'taster' of ongoing research.
Specificaties
Betrokkenen
- Auteur(s):
- Uitgeverij:
Inhoud
- Aantal bladzijden:
- 147
- Taal:
- Engels
Eigenschappen
- Productcode (EAN):
- 9781846284946
- Verschijningsdatum:
- 29/11/2006
- Uitvoering:
- Paperback
- Formaat:
- Trade paperback (VS)
- Afmetingen:
- 208 mm x 277 mm
- Gewicht:
- 390 g

Alleen bij Standaard Boekhandel
Beoordelingen
We publiceren alleen reviews die voldoen aan de voorwaarden voor reviews. Bekijk onze voorwaarden voor reviews.


