- Afhalen na 1 uur in een winkel met voorraad
- Gratis thuislevering in België vanaf € 30
- Ruim aanbod met 7 miljoen producten
- Afhalen na 1 uur in een winkel met voorraad
- Gratis thuislevering in België vanaf € 30
- Ruim aanbod met 7 miljoen producten
Zoeken
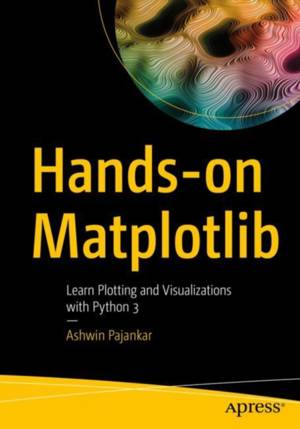
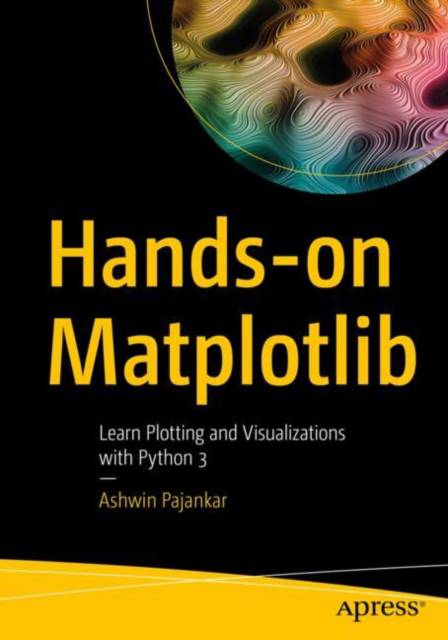
Hands-On Matplotlib
Learn Plotting and Visualizations with Python 3
Ashwin Pajankar
Paperback | Engels
€ 97,45
+ 194 punten
Omschrijving
Learn the core aspects of NumPy, Matplotlib, and Pandas, and use them to write programs with Python 3. This book focuses heavily on various data visualization techniques and will help you acquire expert-level knowledge of working with Matplotlib, a MATLAB-style plotting library for Python programming language that provides an object-oriented API for embedding plots into applications.
You'll begin with an introduction to Python 3 and the scientific Python ecosystem. Next, you'll explore NumPy and ndarray data structures, creation routines, and data visualization. You'll examine useful concepts related to style sheets, legends, and layouts, followed by line, bar, and scatter plots. Chapters then cover recipes of histograms, contours, streamplots, and heatmaps, and how to visualize images and audio with pie and polar charts.
Moving forward, you'll learn how to visualize with pcolor, pcolormesh, and colorbar, and how to visualize in 3D in Matplotlib, create simple animations, and embed Matplotlib with different frameworks. The concluding chapters cover how to visualize data with Pandas and Matplotlib, Seaborn, and how to work with the real-life data and visualize it. After reading Hands-on Matplotlib you'll be proficient with Matplotlib and able to comfortably work with ndarrays in NumPy and data frames in Pandas.
What You'll Learn
Data scientists, machine learning engineers and software professionals with basic programming skills.
You'll begin with an introduction to Python 3 and the scientific Python ecosystem. Next, you'll explore NumPy and ndarray data structures, creation routines, and data visualization. You'll examine useful concepts related to style sheets, legends, and layouts, followed by line, bar, and scatter plots. Chapters then cover recipes of histograms, contours, streamplots, and heatmaps, and how to visualize images and audio with pie and polar charts.
Moving forward, you'll learn how to visualize with pcolor, pcolormesh, and colorbar, and how to visualize in 3D in Matplotlib, create simple animations, and embed Matplotlib with different frameworks. The concluding chapters cover how to visualize data with Pandas and Matplotlib, Seaborn, and how to work with the real-life data and visualize it. After reading Hands-on Matplotlib you'll be proficient with Matplotlib and able to comfortably work with ndarrays in NumPy and data frames in Pandas.
What You'll Learn
- Understand Data Visualization and Python using Matplotlib
- Review the fundamental data structures in NumPy and Pandas
- Work with 3D plotting, visualizations, and animations
- Visualize images and audio data
Data scientists, machine learning engineers and software professionals with basic programming skills.
Specificaties
Betrokkenen
- Auteur(s):
- Uitgeverij:
Inhoud
- Aantal bladzijden:
- 299
- Taal:
- Engels
Eigenschappen
- Productcode (EAN):
- 9781484274095
- Verschijningsdatum:
- 28/11/2021
- Uitvoering:
- Paperback
- Formaat:
- Trade paperback (VS)
- Afmetingen:
- 178 mm x 254 mm
- Gewicht:
- 557 g

Alleen bij Standaard Boekhandel
+ 194 punten op je klantenkaart van Standaard Boekhandel
Beoordelingen
We publiceren alleen reviews die voldoen aan de voorwaarden voor reviews. Bekijk onze voorwaarden voor reviews.


