- Afhalen na 1 uur in een winkel met voorraad
- Gratis thuislevering in België vanaf € 30
- Ruim aanbod met 7 miljoen producten
- Afhalen na 1 uur in een winkel met voorraad
- Gratis thuislevering in België vanaf € 30
- Ruim aanbod met 7 miljoen producten
Zoeken
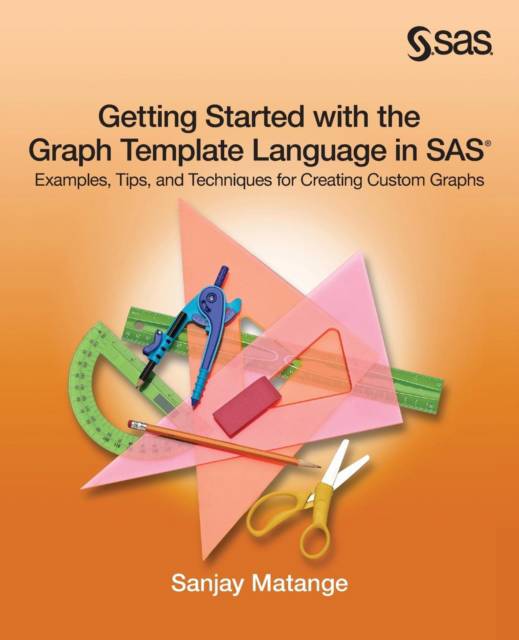
Getting Started with the Graph Template Language in SAS
Examples, Tips, and Techniques for Creating Custom Graphs
Sanjay Matange
Paperback | Engels
€ 41,95
+ 83 punten
Omschrijving
You've just received a new survey of study results, and you need to quickly create custom graphical views of the data. Or, you've completed your analysis, and you need graphs to present the results to your audience, in the style that they prefer. Now, you can create custom graphs quickly and easily with Getting Started with the Graph Template Language in SAS, without having to understand all of the Graph Template Language (GTL) features first. This book will get you started building graphs immediately and will guide you toward a better understanding of the GTL, one step at a time. It shows you the most common approaches to a variety of graphs along with information that you can use to build more complex graphs from there. Sanjay Matange offers expert tips, examples, and techniques, with a goal of providing you with a solid foundation in using the GTL so that you can progress to more sophisticated, adaptable graphs as you need them. Ultimately, Getting Started with the Graph Template Language in SAS allows you to bypass the learning curve. It teaches you how to quickly create custom, aesthetically pleasing graphs that present your data with maximum clarity and minimum clutter. This book is part of the SAS Press program.
Specificaties
Betrokkenen
- Auteur(s):
- Uitgeverij:
Inhoud
- Aantal bladzijden:
- 186
- Taal:
- Engels
Eigenschappen
- Productcode (EAN):
- 9781612907123
- Verschijningsdatum:
- 22/10/2013
- Uitvoering:
- Paperback
- Formaat:
- Trade paperback (VS)
- Afmetingen:
- 190 mm x 235 mm
- Gewicht:
- 331 g

Alleen bij Standaard Boekhandel
+ 83 punten op je klantenkaart van Standaard Boekhandel
Beoordelingen
We publiceren alleen reviews die voldoen aan de voorwaarden voor reviews. Bekijk onze voorwaarden voor reviews.


