
- Afhalen na 1 uur in een winkel met voorraad
- Gratis thuislevering in België vanaf € 30
- Ruim aanbod met 7 miljoen producten
- Afhalen na 1 uur in een winkel met voorraad
- Gratis thuislevering in België vanaf € 30
- Ruim aanbod met 7 miljoen producten


€ 4,45
+ 8 punten
Omschrijving
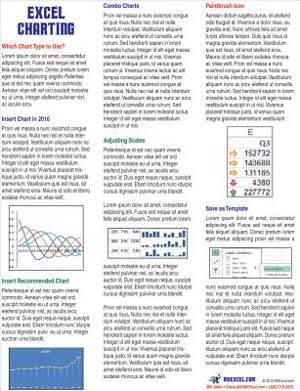
Excel is great at creating charts and graphs, but there are a dizzying 73 chart types available; this tip card teaches the reader when to choose which chart type. For example, to show trends over time, there are certain charts to use, but to show market segmentation, a 2-D pie chart should be used. The card also covers the new Excel 2013 charting interfaces and tiny charts called Sparklines, introduced in Excel 2010. Instructions are also included on how to quickly add traffic lights or other icon sets to bring a boring table of monochrome numbers to life.
Specificaties
Betrokkenen
- Auteur(s):
- Uitgeverij:
Inhoud
- Aantal bladzijden:
- 2
- Taal:
- Engels
Eigenschappen
- Productcode (EAN):
- 9781615479986
- Verschijningsdatum:
- 1/10/2013
- Uitvoering:
- Paperback
- Formaat:
- Trade paperback (VS)
- Afmetingen:
- 216 mm x 279 mm
- Gewicht:
- 190 g


Alleen bij Standaard Boekhandel
+ 8 punten op je klantenkaart van Standaard Boekhandel
E-BOOK ACTIE


Beoordelingen
We publiceren alleen reviews die voldoen aan de voorwaarden voor reviews. Bekijk onze voorwaarden voor reviews.