- Afhalen na 1 uur in een winkel met voorraad
- Gratis thuislevering in België vanaf € 30
- Ruim aanbod met 7 miljoen producten
- Afhalen na 1 uur in een winkel met voorraad
- Gratis thuislevering in België vanaf € 30
- Ruim aanbod met 7 miljoen producten
Omschrijving
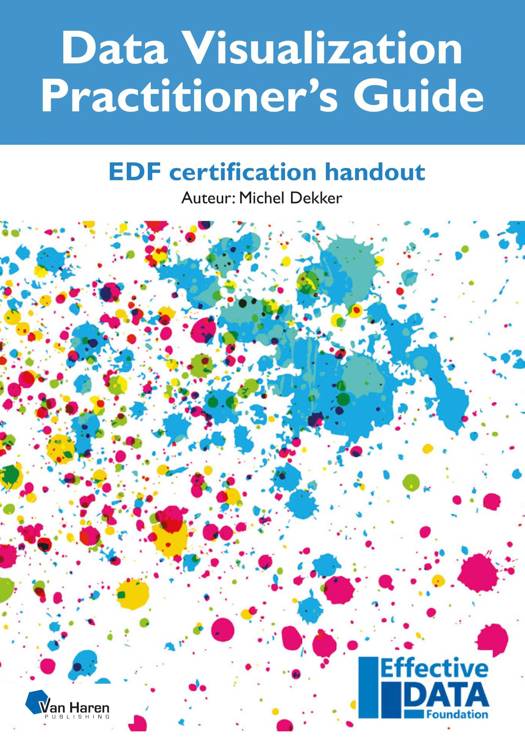
The Data Visualization Practitioner's Guide, functions as textual add on to a Certified Data Visualization Course. The EDF Data Visualization certification demonstrates qualified professionals that have mastered the required skills to visualize data effectively, ensuring that important results will not escape their notice.
The training consists of six modules, each with its own weight towards the certification exam:
Weight
Topic
Introduction
-
Introduction to the data visualization field and basic quantitative thinking.
Human perception
20%
About the principal components of visual perception, to optimize our visualizations for human consumption.
Visualizing data
30%
About applying the knowledge of our visual perception to data visualization and the introduction of the CHRTTS model to select chart types.
Data viz design
25%
About the detailed choices we need to consider when designing our visuals. We also look at the management dashboard and the important role of color.
Storytelling
15%
How to make use of our capacity to tell and consume stories to process data insights.
Workflow
10%
How to implement the effective data visualization practices in our daily work.
Specificaties
Betrokkenen
- Auteur(s):
- Uitgeverij:
Inhoud
- Taal:
- Engels
- Reeks:
Eigenschappen
- Productcode (EAN):
- 9789401811712
- Verschijningsdatum:
- 14/05/2024
- Uitvoering:
- E-book
- Beveiligd met:
- Adobe DRM
- Formaat:

Alleen bij Standaard Boekhandel
Beoordelingen
We publiceren alleen reviews die voldoen aan de voorwaarden voor reviews. Bekijk onze voorwaarden voor reviews.


