- Afhalen na 1 uur in een winkel met voorraad
- Gratis thuislevering in België vanaf € 30
- Ruim aanbod met 7 miljoen producten
- Afhalen na 1 uur in een winkel met voorraad
- Gratis thuislevering in België vanaf € 30
- Ruim aanbod met 7 miljoen producten
Zoeken
€ 101,45
+ 202 punten
Omschrijving
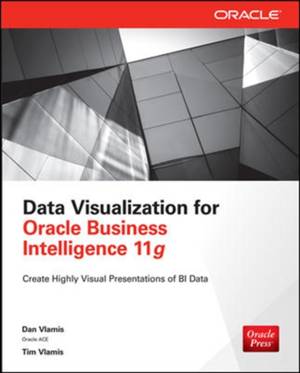
Publisher's Note: Products purchased from Third Party sellers are not guaranteed by the publisher for quality, authenticity, or access to any online entitlements included with the product.Design and Deliver Effective Visual Solutions of BI Data
Cowritten by an Oracle ACE Director and an expert in data visualization design specializing in BI and analytics, Data Visualization for Oracle Business Intelligence 11g reveals best practices for presenting data-driven insights with graphs, tables, maps, dashboards, and other methods that will immediately enhance corporate decision-making. Throughout the book, the principles of effective design are emphasized. Leverage the power of this comprehensive business intelligence platform to deliver rich visualizations of business information across the enterprise.
- Create well-organized tables and pivot tables
- Convey data insights with line, bar, pie, waterfall, radar, and other graphs
- Configure MapViews so that you can provide interactive maps and spatial analysis capabilities
- Build advanced visualizations, including trellis charts, gauges, R images, jQuery sparklines, and more
- Use Oracle Business Intelligence Publisher to create pixel-perfect reports from various data sources
- Design effective, interactive BI dashboards
- Use the Oracle Scorecard and Strategy Management module to measure, evaluate, and manage key performance indicators
- Make smart color choices using data science tools
Specificaties
Betrokkenen
- Auteur(s):
- Uitgeverij:
Inhoud
- Aantal bladzijden:
- 352
- Taal:
- Engels
Eigenschappen
- Productcode (EAN):
- 9780071837262
- Verschijningsdatum:
- 13/02/2015
- Uitvoering:
- Paperback
- Formaat:
- Trade paperback (VS)
- Afmetingen:
- 183 mm x 231 mm
- Gewicht:
- 517 g

Alleen bij Standaard Boekhandel
+ 202 punten op je klantenkaart van Standaard Boekhandel
Beoordelingen
We publiceren alleen reviews die voldoen aan de voorwaarden voor reviews. Bekijk onze voorwaarden voor reviews.


