Je cadeautjes zeker op tijd in huis hebben voor de feestdagen? Kom langs in onze winkels en vind het perfecte geschenk!
- Afhalen na 1 uur in een winkel met voorraad
- Gratis thuislevering in België vanaf € 30
- Ruim aanbod met 7 miljoen producten
Je cadeautjes zeker op tijd in huis hebben voor de feestdagen? Kom langs in onze winkels en vind het perfecte geschenk!
- Afhalen na 1 uur in een winkel met voorraad
- Gratis thuislevering in België vanaf € 30
- Ruim aanbod met 7 miljoen producten
Zoeken
Omschrijving
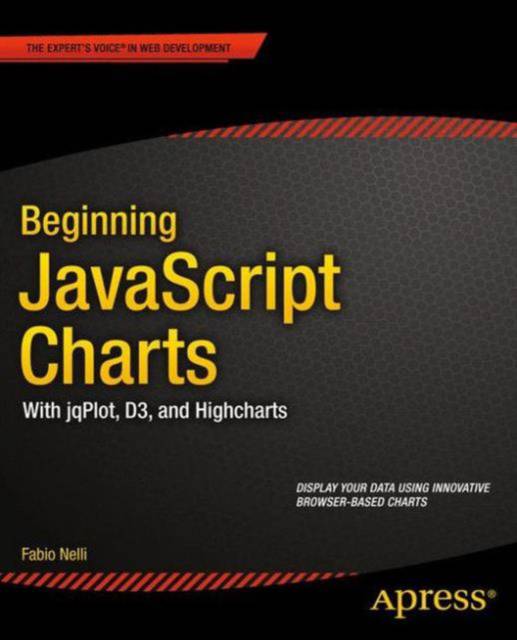
Beginning JavaScript Charts shows how to convert your data into eye-catching, innovative, animated, and highly interactive browser-based charts. This book is suitable for developers of all experience levels and needs: for those who love fast and effective solutions, you can use the jqPlot library to generate charts with amazing effects and animations using only a few lines of code; if you want more power and need to create data visualization beyond traditional charts, then D3 is the JavaScript library for you; finally, if you need a high-performance, professional solution for interactive charts, then the Highcharts library is also covered.
If you are an experienced developer and want to take things further, then Beginning JavaScript Charts also shows you how to develop your own graphics library starting from scratch using jQuery. At the end of the book, you will have a good knowledge of all the elements needed to manage data from every possible source, from high-end scientific instruments to Arduino boards, from PHP SQL databases queries to simple HTML tables, and from Matlab calculations to reports in Excel. You will be able to provide cutting-edge charts exploiting the growing power of modern browsers.
- Create all kinds of charts using the latest technologies available on browsers (HTML5, CSS3, jQuery, jqPlot, D3, Highcharts, and SVG)
- Full of step-by-step examples, Beginning JavaScript Charts introduces you gradually to all aspects of chart development, from the data source to the choice of which solution to apply.
- This book provides a number of tools that can be the starting point for any project requiring graphical representations of data, whether using commercial libraries or your own
Specificaties
Betrokkenen
- Auteur(s):
- Uitgeverij:
Inhoud
- Aantal bladzijden:
- 620
- Taal:
- Engels
- Reeks:
Eigenschappen
- Productcode (EAN):
- 9781430262893
- Verschijningsdatum:
- 13/12/2013
- Uitvoering:
- Paperback
- Formaat:
- Trade paperback (VS)
- Afmetingen:
- 190 mm x 235 mm
- Gewicht:
- 1047 g

Alleen bij Standaard Boekhandel
+ 111 punten op je klantenkaart van Standaard Boekhandel
Beoordelingen
We publiceren alleen reviews die voldoen aan de voorwaarden voor reviews. Bekijk onze voorwaarden voor reviews.


