- Afhalen na 1 uur in een winkel met voorraad
- Gratis thuislevering in België vanaf € 30
- Ruim aanbod met 7 miljoen producten
- Afhalen na 1 uur in een winkel met voorraad
- Gratis thuislevering in België vanaf € 30
- Ruim aanbod met 7 miljoen producten
Omschrijving
Easily Use SAS to Produce Your Graphics
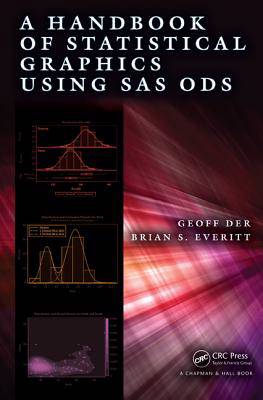
Diagrams, plots, and other types of graphics are indispensable components in nearly all phases of statistical analysis, from the initial assessment of the data to the selection of appropriate statistical models to the diagnosis of the chosen models once they have been fitted to the data. Harnessing the full graphics capabilities of SAS, A Handbook of Statistical Graphics Using SAS ODS covers essential graphical methods needed in every statistician's toolkit. It explains how to implement the methods using SAS 9.4.
The handbook shows how to use SAS to create many types of statistical graphics for exploring data and diagnosing fitted models. It uses SAS's newer ODS graphics throughout as this system offers a number of advantages, including ease of use, high quality of results, consistent appearance, and convenient semiautomatic graphs from the statistical procedures.
Each chapter deals graphically with several sets of example data from a wide variety of areas, such as epidemiology, medicine, and psychology. These examples illustrate the use of graphic displays to give an overview of data, to suggest possible hypotheses for testing new data, and to interpret fitted statistical models. The SAS programs and data sets are available online.
Specificaties
Betrokkenen
- Auteur(s):
- Uitgeverij:
Inhoud
- Aantal bladzijden:
- 244
- Taal:
- Engels
Eigenschappen
- Productcode (EAN):
- 9781466599031
- Verschijningsdatum:
- 15/08/2014
- Uitvoering:
- Hardcover
- Formaat:
- Genaaid
- Afmetingen:
- 155 mm x 236 mm
- Gewicht:
- 498 g

Alleen bij Standaard Boekhandel
Beoordelingen
We publiceren alleen reviews die voldoen aan de voorwaarden voor reviews. Bekijk onze voorwaarden voor reviews.


